

Disease Progression Visual Analysis
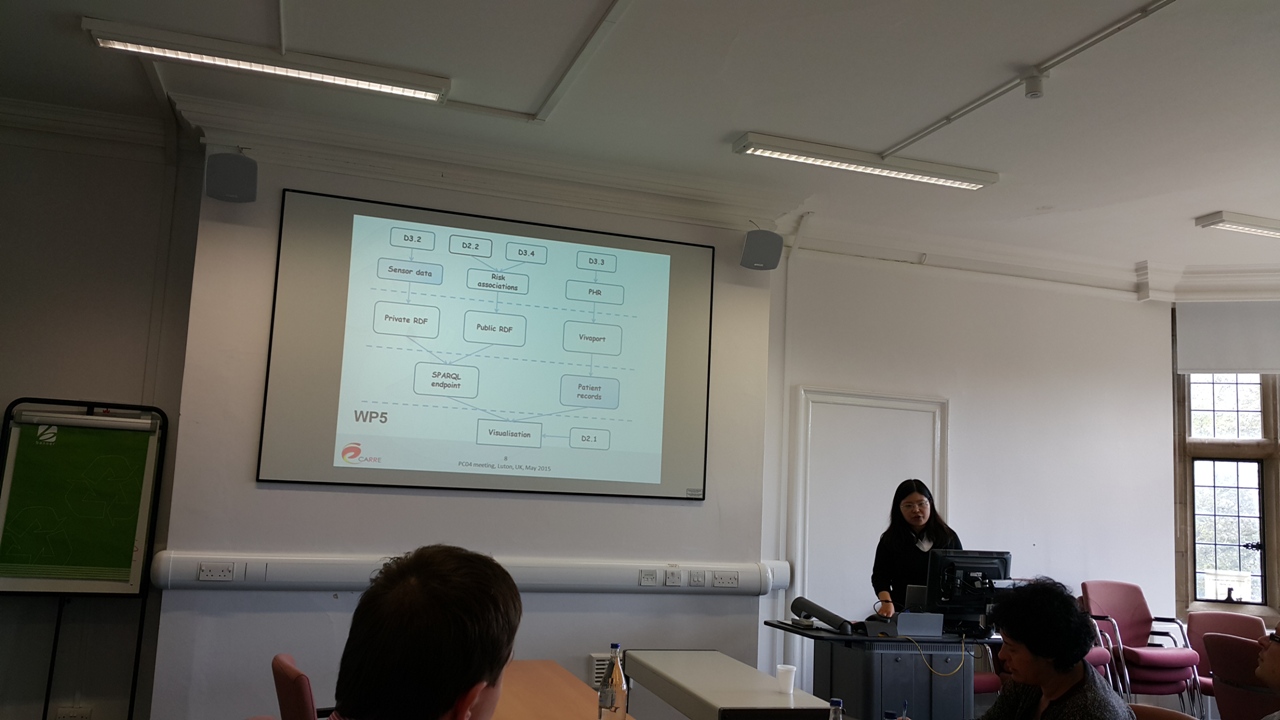
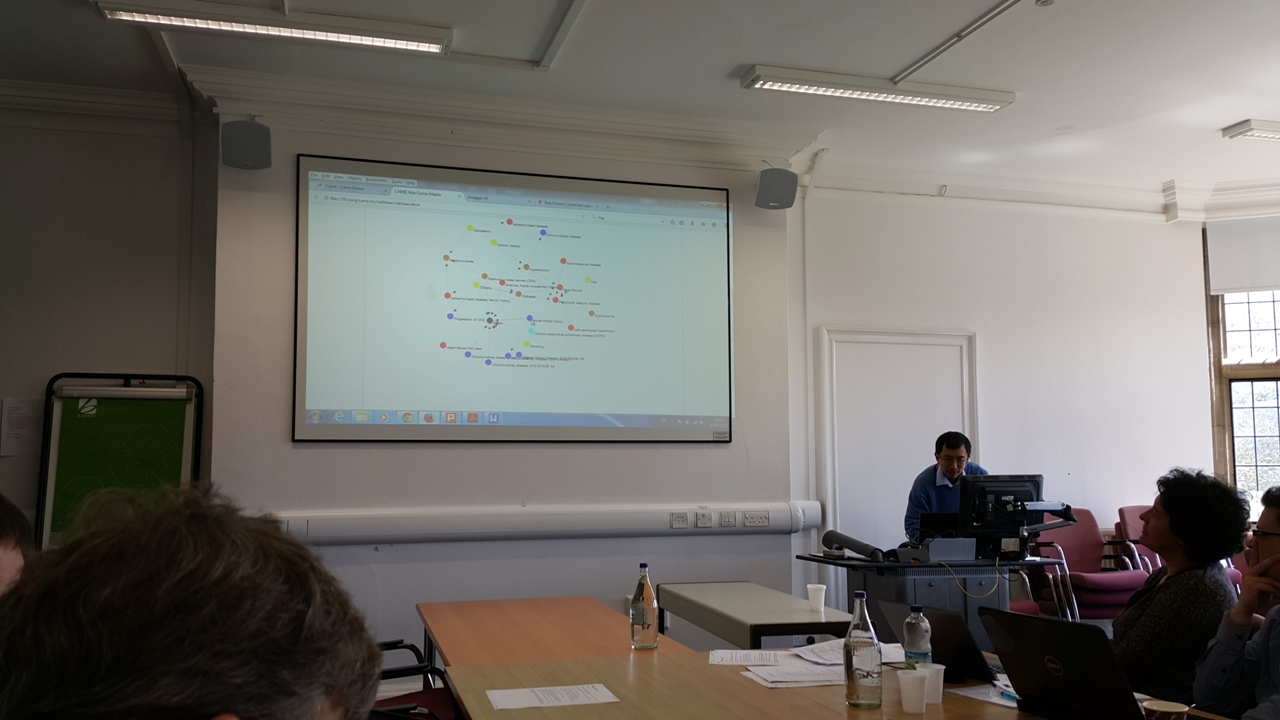
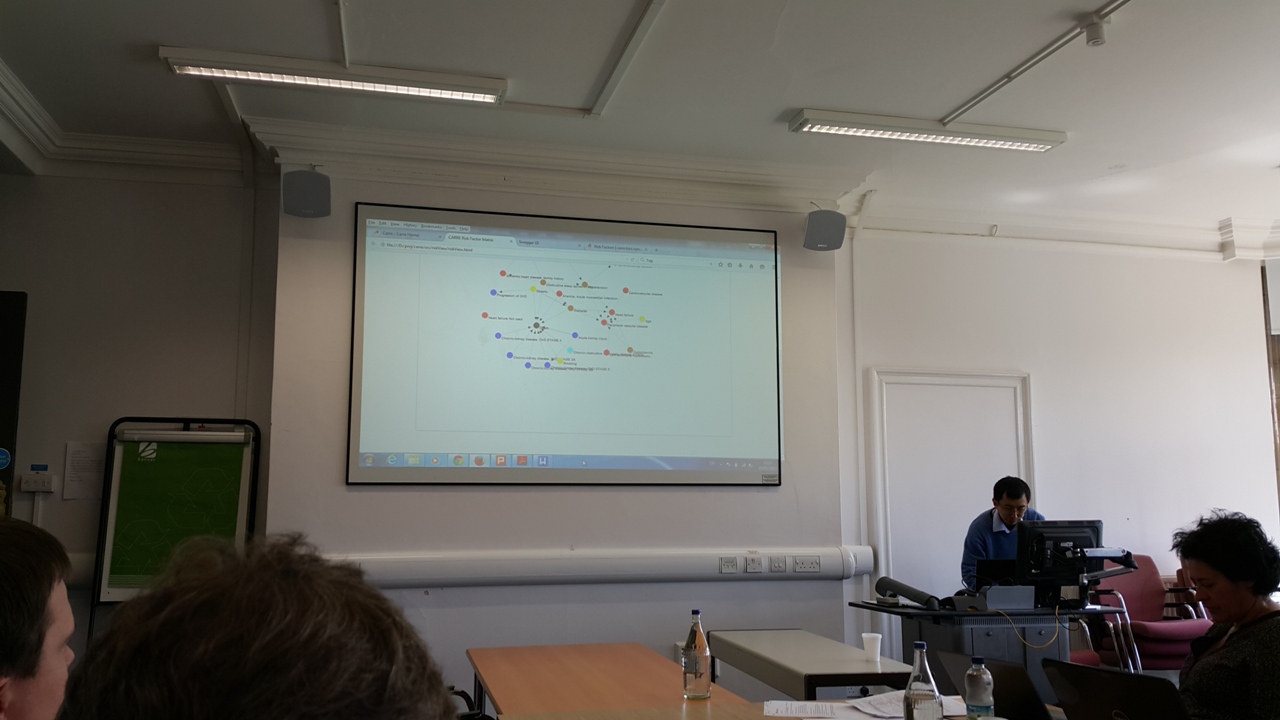
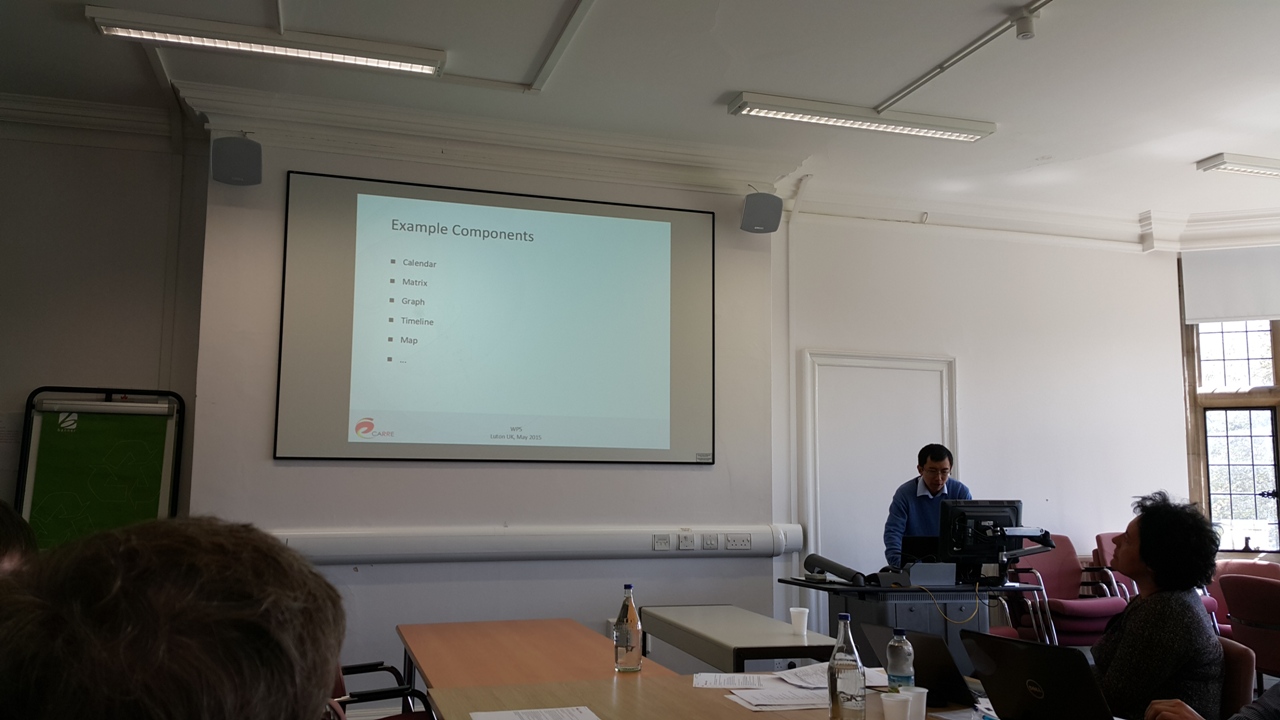
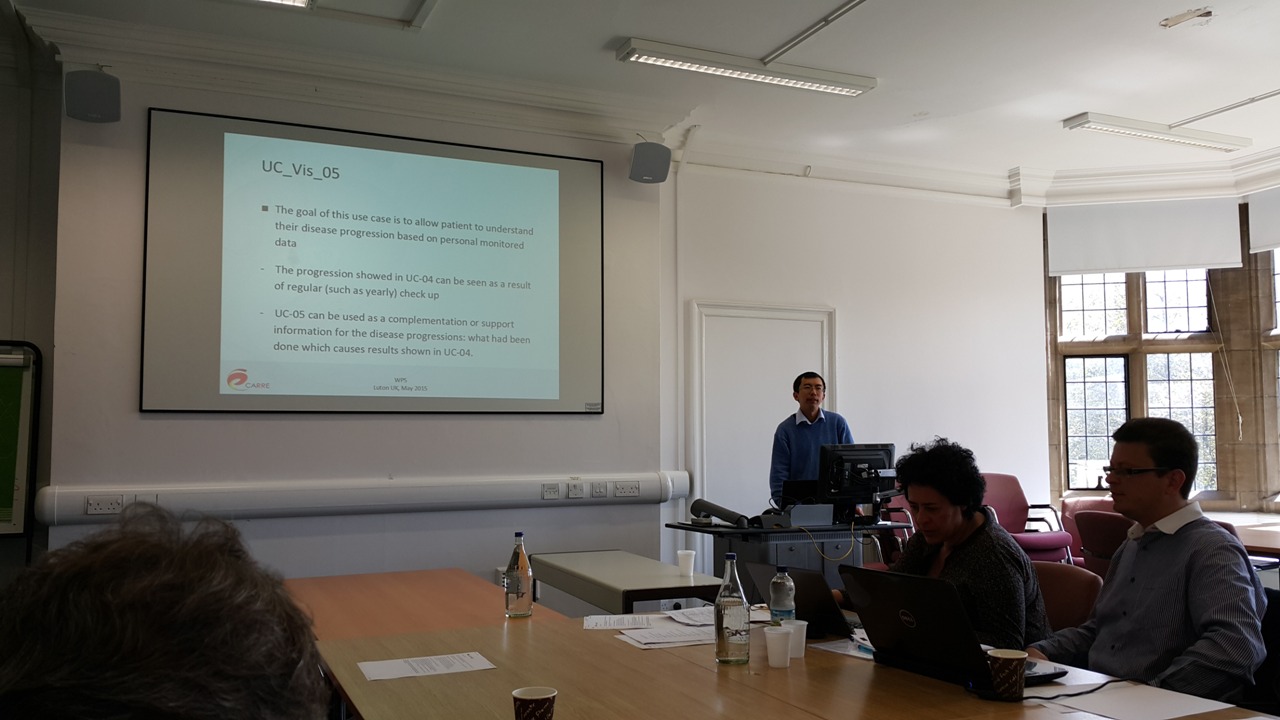
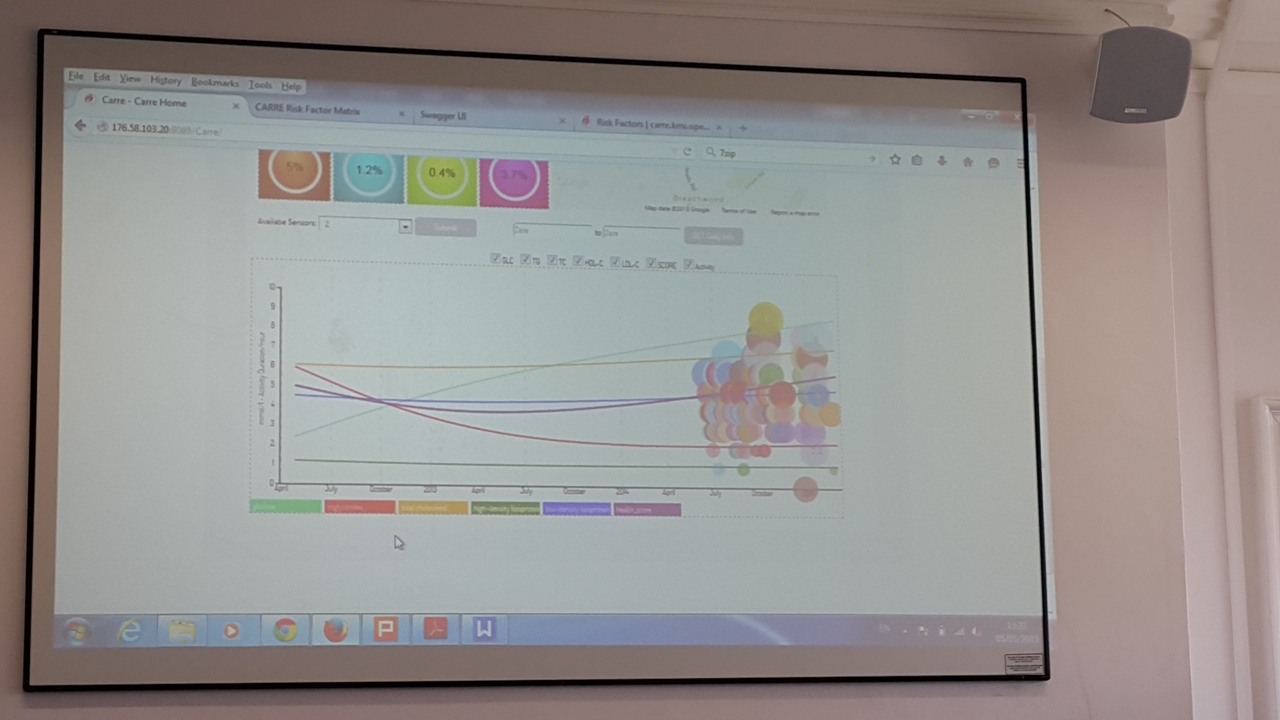
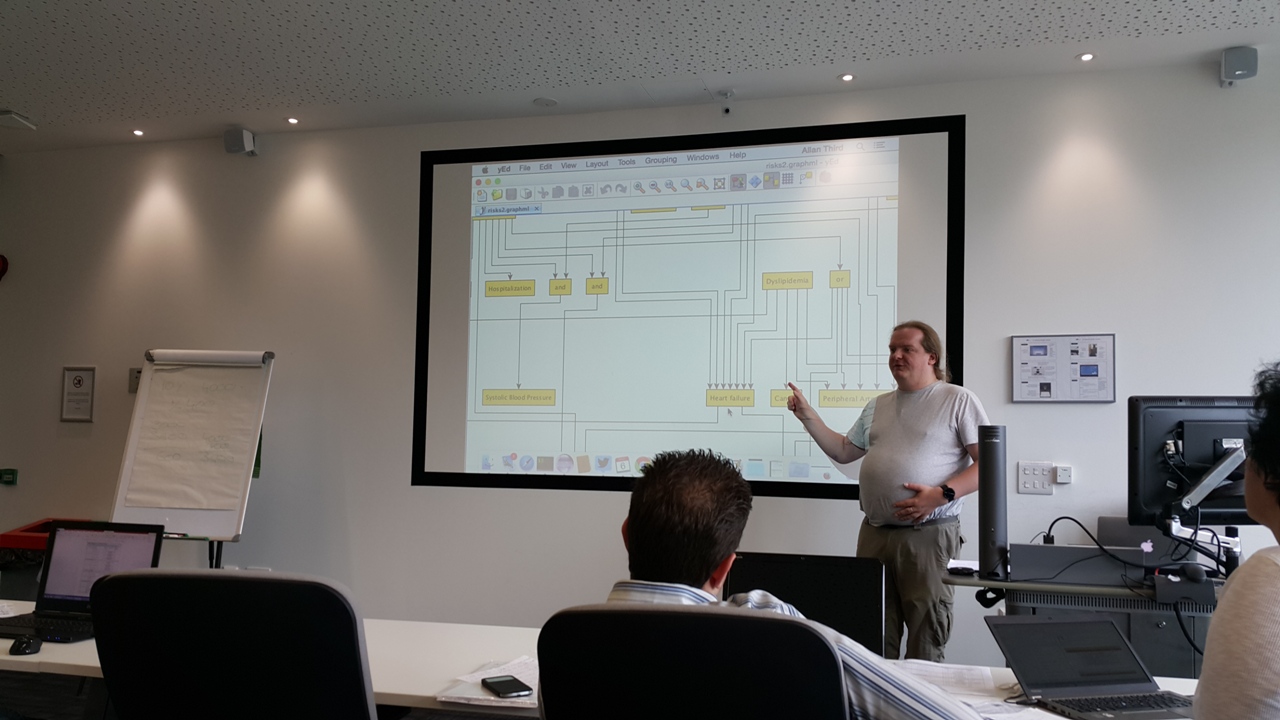
The purpose of disease progression visual analysis is to visualize related risk factors according to the patient’s health and lifestyle status and to visualize the changes that may happen if the user changes the lifestyle or medical indicators. Disease progression visual analysis is an integrated visual analysis of charts, timeline and graph. It is composed…


 3 images
 3 images
 86 images
 86 images
 86 images